[Ralph] is excited about impedance matching, and why not? It is important to match the source and load impedance to get the most power out of a circuit. He’s got a whole series of videos about it. The latest? Matching using a PI network and the venerable Smith Chart.
We like that he makes each video self-contained. It does mean if you watch them all, you get some review, but that’s not a bad thing, really. He also does a great job of outlining simple concepts, such as what a complex conjugate is, that you might have forgotten.
Smith charts almost seem magical, but they are really sort of an analog computer. The color of the line and even the direction of an arrow make a difference, and [Ralph] explains it all very simply.
The example circuit is simple with a 50 MHz signal and a mismatched source and load. Using the steps and watching the examples will make it straightforward, even if you’ve never used a Smith Chart before.
The red lines plot impedance, and the blue lines show conductance and succeptance. Once everything is plotted, you have to find a path between two points on the chart. That Smith was a clever guy.
We looked at part 1 of this series earlier this year, so there are five more to watch since then. If your test gear leaves off the sign of your imaginary component, the Smith Chart can work around that for you.
I often ask people: What’s the most important thing you need to have a successful fishing trip? I get a lot of different answers about bait, equipment, and boats. Some people tell me beer. But the best answer, in my opinion, is fish. Without fish, you are sure to come home empty-handed.
On a recent visit to Bletchley Park, I thought about this and how it relates to World War II codebreaking. All the computers and smart people in the world won’t help you decode messages if you don’t already have the messages. So while Alan Turing and the codebreakers at Bletchley are well-known, at least in our circles, fewer people know about Arkley View.
The problem was apparent to the British. The Axis powers were sending lots of radio traffic. It would take a literal army of radio operators to record it all. Colonel Adrian Simpson sent a report to the director of MI5 in 1938 explaining that the three listening stations were not enough. The proposal was to build a network of volunteers to handle radio traffic interception.
That was the start of the Radio Security Service (RSS), which started operating out of some unused cells at a prison in London. The volunteers? Experienced ham radio operators who used their own equipment, at first, with the particular goal of intercepting transmissions from enemy agents on home soil.
At the start of the war, ham operators had their transmitters impounded. However, they still had their receivers and, of course, could all read Morse code. Further, they were probably accustomed to pulling out Morse code messages under challenging radio conditions.
Over time, this volunteer army of hams would swell to about 1,500 members. The RSS also supplied some radio gear to help in the task. MI5 checked each potential member, and the local police would visit to ensure the applicant was trustworthy. Keep in mind that radio intercepts were also done by servicemen and women (especially women) although many of them were engaged in reporting on voice communication or military communications.
Early Days
The VIs (voluntary interceptors) were asked to record any station they couldn’t identify and submit a log that included the messages to the RSS.
The hams of the RSS noticed that there were German signals that used standard ham radio codes (like Q signals and the prosign 73). However, these transmissions also used five-letter code groups, a practice forbidden to hams.
Thanks to a double agent, the RSS was able to decode the messages that were between agents in Europe and their Abwehr handlers back in Germany (the Abwehr was the German Secret Service) as well as Abwehr offices in foreign cities. Later messages contained Enigma-coded groups, as well.
Between the RSS team’s growth and the fear of bombing, the prison was traded for Arkley View, a large house near Barnet, north of London. Encoded messages went to Bletchley and, from there, to others up to Churchill. Soon, the RSS had orders to concentrate on the Abwehr and their SS rivals, the Sicherheitsdienst.
Change in Management
In 1941, MI6 decided that since the RSS was dealing with foreign radio traffic, they should be in charge, and thus RSS became SCU3 (Special Communications Unit 3).
There was fear that some operators might be taken away for normal military service, so some operators were inducted into the Army — sort of. They were put in uniform as part of the Royal Corps of Signals, but not required to do very much you’d expect from an Army recruit.
Those who worked at Arkley View would process logs from VIs and other radio operators to classify them and correlate them in cases where there were multiple logs. One operator might miss a few characters that could be found in a different log, for example.
It soon became clear that the RSS needed full-time monitoring, so they built a number of Y stations with two National HRO receivers from America at each listening position. There were also direction-finding stations built in various locations to attempt to identify where a remote transmitter was.
Many of the direction finding operators came from VIs. The stations typically had four antennas in a directional array. When one of the central stations (the Y stations) picked up a signal, they would call direction finding stations using dedicated phone lines and send them the signal.
The operator would hear the phone signal in one ear and the radio signal in the other. Then, they would change the antenna pattern electrically until the signal went quiet, indicating the antenna was electrically pointing away from the signals.
The DF operator would hear this signal in one earpiece. They would then tune their radio receiver to the right frequency and match the signal from the main station in one ear to the signal from their receiver in the other ear. This made sure they were measuring the correct signal among the various other noise and interference. The DF operator would then take a bearing by rotating the dial on their radiogoniometer until the signal faded out. That indicated the antenna was pointing the wrong way which means you could deduce which way it should be pointing.
The central station could plot lines from three direction finding stations and tell the source of a transmission. Sort of. It wasn’t incredibly accurate, but it did help differentiate signals from different transmitters. Later, other types of direction-finding gear saw service, but the idea was still the same.
Interesting VIs
Most of the VIs, like most hams at the time, were men. But there were a few women, including Helena Crawley. She was encouraged to marry her husband Leslie, another VI, so they could be relocated to Orkney to copy radio traffic from Norway.
In 1941, a single VI was able to record an important message of 4,429 characters. He was bedridden from a landmine injury during the Great War. He operated from bed using mirrors and special control extensions. For his work, he receive the British Empire Medal and a personal letter of gratitude from Churchill.
Results
Because of the intercepts of the German spy agency’s communications, many potential German agents were known before they arrived in the UK. Of about 120 agents arriving, almost 30 were turned into double agents. Others were arrested and, possibly, executed.
By the end of the war, the RSS had decoded around a quarter of a million intercepts. It was very smart of MI5 to realize that it could leverage a large number of trained radio operators both to cover the country with receivers and to free up military stations for other uses.
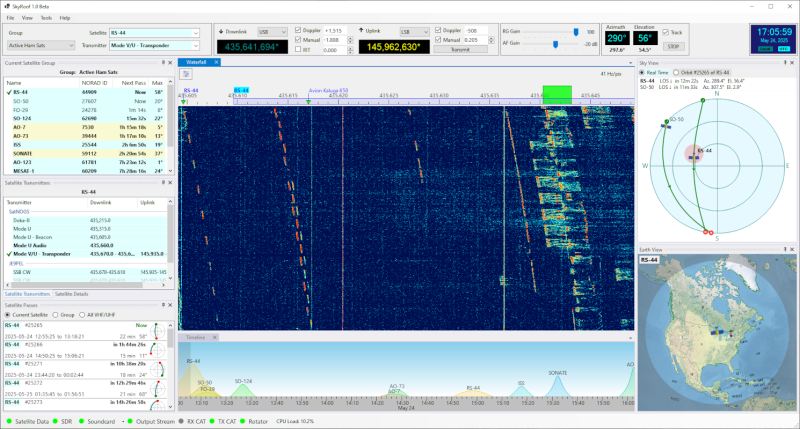
Communicating with space-based ham radio satellites might sound like it’s something that takes a lot of money, but in reality it’s one of the more accessible aspects of the hobby. Generally all that’s needed is a five-watt handheld transceiver and a directional antenna. Like most things in the ham radio world, though, it takes a certain amount of skill which can’t be easily purchased. Most hams using satellites like these will rely on some software to help track them, which is where this new program from [Alex Shovkoplyas] comes in.
The open source application is called SkyRoof and provides a number of layers of information about satellites aggregated into a single information feed. A waterfall diagram is central to the display, with not only the satellite communications shown on the plot but information about the satellites themselves. From there the user can choose between a number of other layers of information about the satellites including their current paths, future path prediction, and a few different ways of displaying all of this information. The software also interfaces with radios via CAT control, and can even automatically correct for the Doppler shift that is so often found in satellite radio communications.
For any ham actively engaged in satellite tracking or space-based repeater communications, this tool is certainly worth trying out. Unfortunately, it’s only available for Windows currently. For those not looking to operate under Microsoft’s thumb, projects such as DragonOS do a good job of collecting up the must-have Linux programs for hams and other radio enthusiasts.
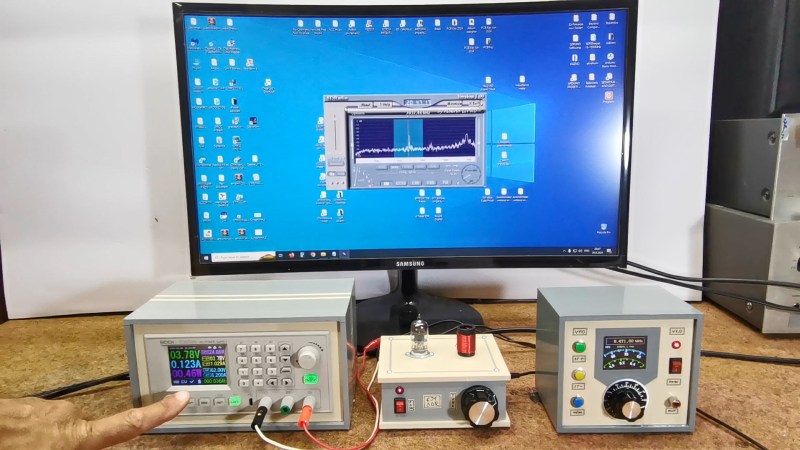
Software Defined Radio (SDR) is the big thing these days, and why not? A single computer can get rid of a room full of boat anchors, and give you better signal discrimination than all but the best kit. Any SDR project needs an RF receiver, and in this project [mircemk] used a single 6J1 vaccum tube to produce an SSB SDR that combines the best of old and new.
Single-tube radios are a classic hack, and where a lot of hams got started back in the day, but there is a reason more complicated circuits tend to be used. On the other hand, if you can throw a PC worth of signal processing at the output, it looks like you can get a very sensitive and selective single-sideband (SSB) receiver.
The 6J1 tube is convenient, since it can run on only 6 V (or down to 3.7 as [mircemk] demonstrates). Here it is used as a mixer, with the oscillator signal injected via the screen grid. Aside from that, the simple circuit consists of a receiving coil, a few resistors and a variable capacitor. How well does it work? Quite well, when paired with a PC; you can judge for yourself in the video embedded below.
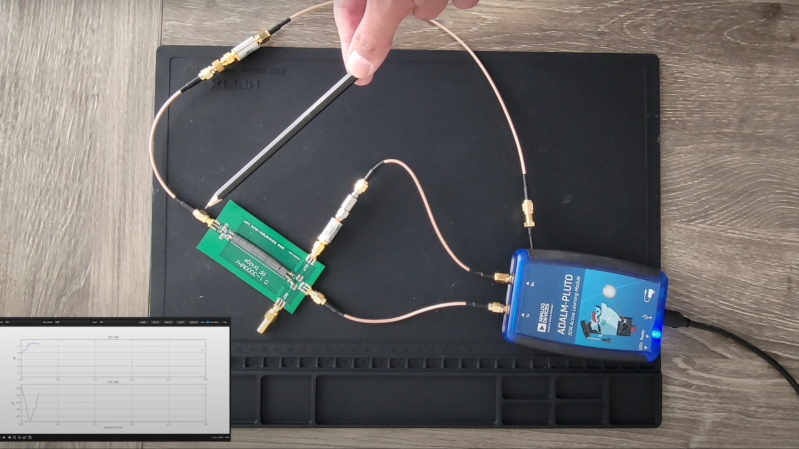
Usually when we see a project using a software-defined radio (SDR), the SDR’s inputs and outputs are connected to antennae, but [FromConceptToCircuit]’s project connected an ADALM-Pluto SDR to an RF bridge and a few passive components to make a surprisingly effective network analyzer (part two of the video).
The network analyzer measures two properties of the circuit to which it is connected: return loss (S11) and insertion gain or loss (S21). To measure S21, the SDR feeds a series of tones to the device under test, and reads the device’s output from one of the SDR’s inputs. By comparing the amplitude of the input to the device’s output, a Python program can calculate S21 over the range of tested frequencies. To find S11, [FromConceptToCircuit] put an RF bridge in line with the device being tested and connected the bridge’s output to the SDR’s second input. This allowed the program to calculate the device’s impedance, and from that S11.
The RF bridge and other components introduce some inaccuracies to the measurements, so before making any other measurements, the system is calibrated with both a through connection and an open circuit in place of the tested device. The RF bridge’s directivity was the biggest limiting factor; transfer back from the bridge’s output line caused the reflection under load to exceed the reflection of an open circuit in some frequency ranges, at which point the analyzer couldn’t accurately operate.
[FromConceptToCircuit] was eventually able to make measurements throughout most of the 0.1-3 GHz range with a dynamic range of at least 10 dB, and expects a more directive RF bridge to give even better results. If you’d like to repeat the experiment, he’s made his Python program available on GitHub.
You turn the dial on your radio, and hear a powerful source of interference crackle in over the baseline noise. You’re interested as to where it might be coming from. You’re receiving it well, and the signal strength is strong, but is that because it’s close or just particularly powerful? What could it be? How would you even go about tracking it down?
When it comes to hunting down radio transmissions, Justin McAllister and Nick Foster have a great deal of experience in this regard. They came down to the 2024 Hackaday Superconference to show us how it’s done.
Transmissions From Where?
Nick Foster opens the talk by discussing how the first job is often to figure out what you’re seeing when you pick up a radio transmission. “The moral of this talk is that your hardware is always lying to you,” says Nick. “In this talk, we’re going to show you how your radio lies to you, what you can do about it, and if your hardware is not lying to you, what is that real station that you’re looking at?” It can be difficult to tease out the truth of what the radio might seem to be picking up. “How do we determine what a signal actually is?” he asks. “Is it a real signal that we’re looking at which is being transmitted deliberately from somebody else, or is it interference from a bad power supply, or is it a birdie—a signal that’s created entirely within my own radio that doesn’t exist at all?”
There are common tools used to perform this work of identifying just what the radio is actually picking up and where it’s coming from. Justin goes over some of the typical hardware, noting that the RX-888 is a popular choice for software-defined radio that can be tuned across HF, VHF, and UHF bands. It’s highly flexible, and it’s affordable to boot, as is the Web-888 which can be accessed conveniently over a web browser. Other common SDRs are useful, too, as are a variety of filters that can aid with more precise investigations.
Justin demonstrates an errant radio emission from the brushed motor in his furnace, noting how it varies in bandwidth—a surefire tell versus intentional radio transmissions.
Establishing a grounding in reality is key, Justin steps up to explain. “We turn our SDR on, we stick [on] the little antenna that comes with it, and we start looking at something,” says Justin. “Are the signals that we see there actually real?” He notes that there are some basics to consider right off the bat. “One key point to make is that nobody makes money or has good communication using an unmodulated carrier,” he points out. “If you just see a tone somewhere, it might be real, but there’s a good chance that it’s not.”
It’s perhaps more likely unintentional radiation, noise, or something generated inside the hardware itself on your end. It’s also worth looking at whether you’re looking at a fixed frequency or a changing frequency to pin things down further. Gesturing to a spectrogram, he notes that the long, persistent lines on the spectrogram are usually clues to more intentional transmissions. Intermittent squiggles are more often unintentional. Justin points at some that he puts down to the emissions from arc welders, sparking away as they do, and gives an example of what emissions from typical switching power supplies look like.
There are other hints to look out for, too. Real human-made signals tend to have some logic to them. Justin notes that real signals usually make “efficient” use of spectrum without big gaps or pointless repetition. It’s also possible to make judgement calls as to whether a given signal makes sense for the band it appears to be transmitted in. Schedule can be a tell, too—if a signal always pops up when your neighbor gets home at 6 PM, it might just be coming from their garage door remote. Justin notes a useful technique for hunting down possible nearby emitters—”Flipping on and off switches is a real good way of figuring out—is it close to me or not?”
SDRs are hugely flexible, but they also have very open front-ends that can lead to some confusing output.
Nick follows up by discussing the tendency of sampling radios to show up unique bizarre transmissions that aren’t apparent on an analog receiver. “One of the curses of the RTL-SDR is actually one of its strengths… it has a completely wide open front end,” notes Nick. “Its ADC which is sampling and capturing the RF has basically nothing except an amplifier in between it and whatever crud you’re putting into it.” This provides great sensitivity and frequency agility, but there’s a catch—”It will happily eat up and spit out lots of horrible stuff,” says Nick. He goes on to explain various ways such an SDR might lie to the user. A single signal might start popping up all over the frequency band, or interfere with other signals coming in from the antenna. He also highlights a great sanity check for hunting down birdies—”If it’s always there, if it’s unchanging, if you unplug your antenna and you still hear it—it’s probably generated in your radio!”
The rest of the talk covers locating transmissions—are they in your house, in the local community, or from even farther afield? It explores the technique of multilateration, where synchronized receivers and maths are used to measure the time differences seen in the signal at each point to determine exactly where a transmission is coming from. The talk also goes over common sources of noise in residential settings—cheap PWM LED lights, or knock-off laptop chargers being a prime example in Nick’s experience. There’s also a discussion of how the noise floor has shifted up a long way compared to 50 years ago, now that the world is full of so many more noise-emitting appliances.
Ultimately, the duo of Justin and Nick brought us a great pun-filled talk on sleuthing for the true source of radio transmissions. If you’ve ever wondered about how to track down some mystery transmitter, you would do well to watch and learn from the techniques explored within